A Simple Guide to Research Methodology for Beginners
If you're just starting out, the best way to think about research methodology is as the master plan for your entire project. It’s the "how" and "why" behind your investigation, explaining exactly how you'll gather and make sense of information to answer your research question.
It’s the difference between randomly throwing ingredients in a bowl and hoping for the best versus following a proven recipe to bake a perfect cake. One leads to a mess; the other leads to a reliable result.
What Is Research Methodology Anyway?

Let's cut through the academic jargon. Research methodology isn't some stuffy, intimidating concept—it's your project's game plan. This blueprint is what gives your work credibility and proves your findings are more than just guesses. They're the outcome of a logical, well-thought-out process.
Think of yourself as a detective trying to crack a case. You wouldn't just wander around town talking to random people. You’d have a strategy. You'd decide what evidence you need (fingerprints, witness statements), how you'll get it (dusting for prints, conducting interviews), and how you'll piece it all together to build a convincing argument. That structured approach? That's your methodology.
The Core Components of Your Research Plan
A solid research methodology, especially for a beginner, really just breaks down into three essential parts. Get these straight, and you’ll have a clear roadmap for your entire project.
- Your Overall Approach: This is your big-picture strategy. Are you going to measure things with numbers (quantitative) or explore experiences with words (qualitative)?
- Your Data Collection Methods: These are the specific tools in your toolkit. We're talking about things like surveys, interviews, experiments, or even just careful observation.
- Your Analysis Techniques: This is how you'll make sense of all the information you've gathered. Will you be running statistical models to find patterns or identifying key themes from conversations?
Getting this right from the beginning truly matters. A 2023 global survey found that 67% of novice researchers who got formal training could design a competent survey, while only 42% of those who tried to teach themselves could say the same. A little structure goes a long way.
Your research methodology is the backbone of your study. It's the system that connects your research question to your conclusion, ensuring the journey between them is logical, valid, and repeatable by others.
Quick Look at Core Research Approaches
To help you get your bearings, here's a simple breakdown of the three fundamental approaches you'll come across. Each one is designed for a different purpose, and picking the right one is all about what you want to find out.
| Approach | Primary Goal | Data Type | Common Methods |
|---|---|---|---|
| Quantitative | To test hypotheses, measure variables, and find patterns | Numerical | Surveys, Experiments, Statistical Analysis |
| Qualitative | To explore ideas, understand experiences, and gain depth | Non-numerical (text, audio, video) | Interviews, Focus Groups, Case Studies |
| Mixed-Methods | To combine the strengths of both for a complete picture | Both numerical and non-numerical | Surveys with open-ended questions, Case studies with stats |
This table gives you a starting point for thinking about which path makes the most sense for your question.
Ultimately, having a clear methodology gives you the confidence to move forward. As you get more advanced, looking into resources from organizations like the Advanced Research Society for Science and Sociology can help you explore the broader academic world.
Choosing Between Numbers and Narratives
When you're starting out in research, you'll find it primarily speaks two languages: the language of numbers and the language of narratives. Getting a feel for when to use each is one of the most fundamental steps in building a solid research plan. This choice will ripple through your entire project, influencing everything from the questions you ask to the conclusions you ultimately draw.

Think of it this way: quantitative research is like a multiple-choice poll. Its purpose is to count things, measure trends, and give you a clean, numerical snapshot of what's happening. How many people chose product A over product B? What percentage of the class passed the final? The answers are clear, measurable, and to the point.
On the flip side, qualitative research is like a deep, one-on-one conversation. It’s not about counting the votes but understanding why people voted that way in the first place. It gets into the feelings, personal experiences, and motivations bubbling under the surface to uncover rich, contextual stories.
Neither one is better than the other. They just answer different types of questions. In fact, the most powerful research often finds a way to blend them, letting both the numbers and the narratives work together to tell the full story.
Understanding Quantitative Research: The Language of Numbers
Quantitative research is your go-to when you need to confirm a theory or test a hypothesis. It’s all about gathering numerical data and running it through statistical analysis to spot patterns, make predictions, or generalize your findings to a much larger group of people.
Historically, this structured approach gained serious traction over the last few decades. By the 1980s, quantitative methods were dominant in many fields, making up around 60-70% of published social science studies as tools like surveys and statistical modeling became more accessible. You can even explore more about the research trends shaping industries to see how these methods keep evolving.
Common quantitative methods include:
- Surveys and Questionnaires: Asking a large group the same set of closed-ended questions (think multiple-choice or rating scales).
- Experiments: Carefully controlling variables to figure out direct cause-and-effect relationships.
- Statistical Analysis: Digging into existing datasets to find correlations or track trends over time.
This approach is brilliant at providing objective, black-and-white answers to questions that start with "How many," "How often," or "What is the relationship between..."
When to Use It: Go with a quantitative approach when you need to validate a hypothesis, measure a large-scale trend, or compare specific variables with precision. It tells you the "what."
Exploring Qualitative Research: The Power of Stories
While numbers give you the scale of an issue, stories give you its soul. Qualitative research is all about exploration. It aims to understand the underlying reasons, opinions, and motivations that drive human behavior. It's perfect for gaining initial insights into a problem or even helping you develop ideas for a future quantitative study.
This approach is less about measurement and more about meaning. It uses methods that collect rich, descriptive data that you just can't boil down to a simple number. It's the right tool for answering questions that begin with "Why," "How," or "What are the experiences of..."
You’ll see these methods pop up all the time in qualitative work:
- In-depth Interviews: Open-ended, one-on-one conversations that let you explore a topic from an individual's unique perspective.
- Focus Groups: Guided discussions with a small group of people to gather collective insights and see how ideas bounce off one another.
- Case Studies: A deep, detailed investigation into a single person, group, or event to get a complete, holistic understanding.
- Observation: Simply watching and documenting behavior in a natural setting to see how people act when they're in their own environment.
The real strength here is depth. You might only talk to ten people, but the insights from those ten conversations can be far more revealing than a thousand simple survey responses.
A Tale of Two Coffee Shops: An Example
Let’s make this real. Imagine you own two coffee shops: "The Daily Grind" and "The Morning Brew." You want to figure out what your customers think.
- Your Quantitative Approach: You send out a survey asking customers to rate their experience on a scale of 1 to 5. The data comes back: The Daily Grind has an average rating of 4.5/5, while The Morning Brew is sitting at 3.2/5. Now you know what is happening. The Daily Grind is clearly more popular.
- Your Qualitative Approach: But the numbers don't tell you why. So, you sit down for a few in-depth interviews with customers from both shops. You quickly discover that people adore The Daily Grind's friendly baristas and cozy seating, even though it costs a bit more. On the other hand, customers at The Morning Brew complain about the loud music and slow service, even though they think the coffee itself is great.
By combining both methods, you get the whole picture. The numbers flagged the problem, but the stories told you exactly how to fix it. This is a perfect example of how a well-rounded research plan can lead to truly actionable insights.
Designing Your Research Project From Scratch
Okay, you've got the basics of quantitative and qualitative methods down. Now it's time to put that theory into practice. Think of designing a research project like drawing up the blueprints for a house. It's the critical planning stage where you make sure every part of your study fits together logically to build a strong, credible conclusion.
This is where you turn a vague curiosity into a focused, manageable investigation. Every great research project begins not with collecting data, but with a crystal-clear question.
Start with a Powerful Research Question
Your research question is the single most important element of your project. It's your North Star—it guides every single decision you'll make, from the methods you choose to how you analyze your findings. A weak or fuzzy question almost always leads to a confusing project, but a sharp, focused one gives you a clear path forward.
It’s like planning a road trip. "Let's go somewhere" is a terrible plan. But "Let's drive from Chicago to Los Angeles along Route 66 to see the historic motels" gives you a clear destination, a route, and a purpose.
A great research question is:
- Focused: It zooms in on a single problem. Instead of "What about remote work?" a better question is, "How does the frequency of weekly team meetings affect collaboration in fully remote marketing teams?"
- Researchable: You have to be able to actually collect data to answer it. A question like, "What is the meaning of life?" is a fascinating philosophical puzzle, but it's not a researchable topic.
- Feasible: Can you realistically answer it with the time, money, and resources you have?
This first step—nailing down the question—is where you decide what you truly want to discover.
Choosing Your Methodology and Population
Once your question is locked in, the next step is choosing the right tools for the job. Your question will naturally point you toward a quantitative, qualitative, or mixed-methods approach.
Is your question about measuring, comparing, or testing something? For example, "Does this new teaching method improve test scores by more than 10%?" That's a clear signal you're leaning toward quantitative methods like experiments or large-scale surveys.
Or is your question about exploring, understanding, or describing an experience? Something like, "What are the lived experiences of first-year students transitioning to college life?" This is pointing you straight toward a qualitative approach using in-depth interviews or case studies.
The infographic below shows how your research question acts as a fork in the road, guiding you toward one path or the other.
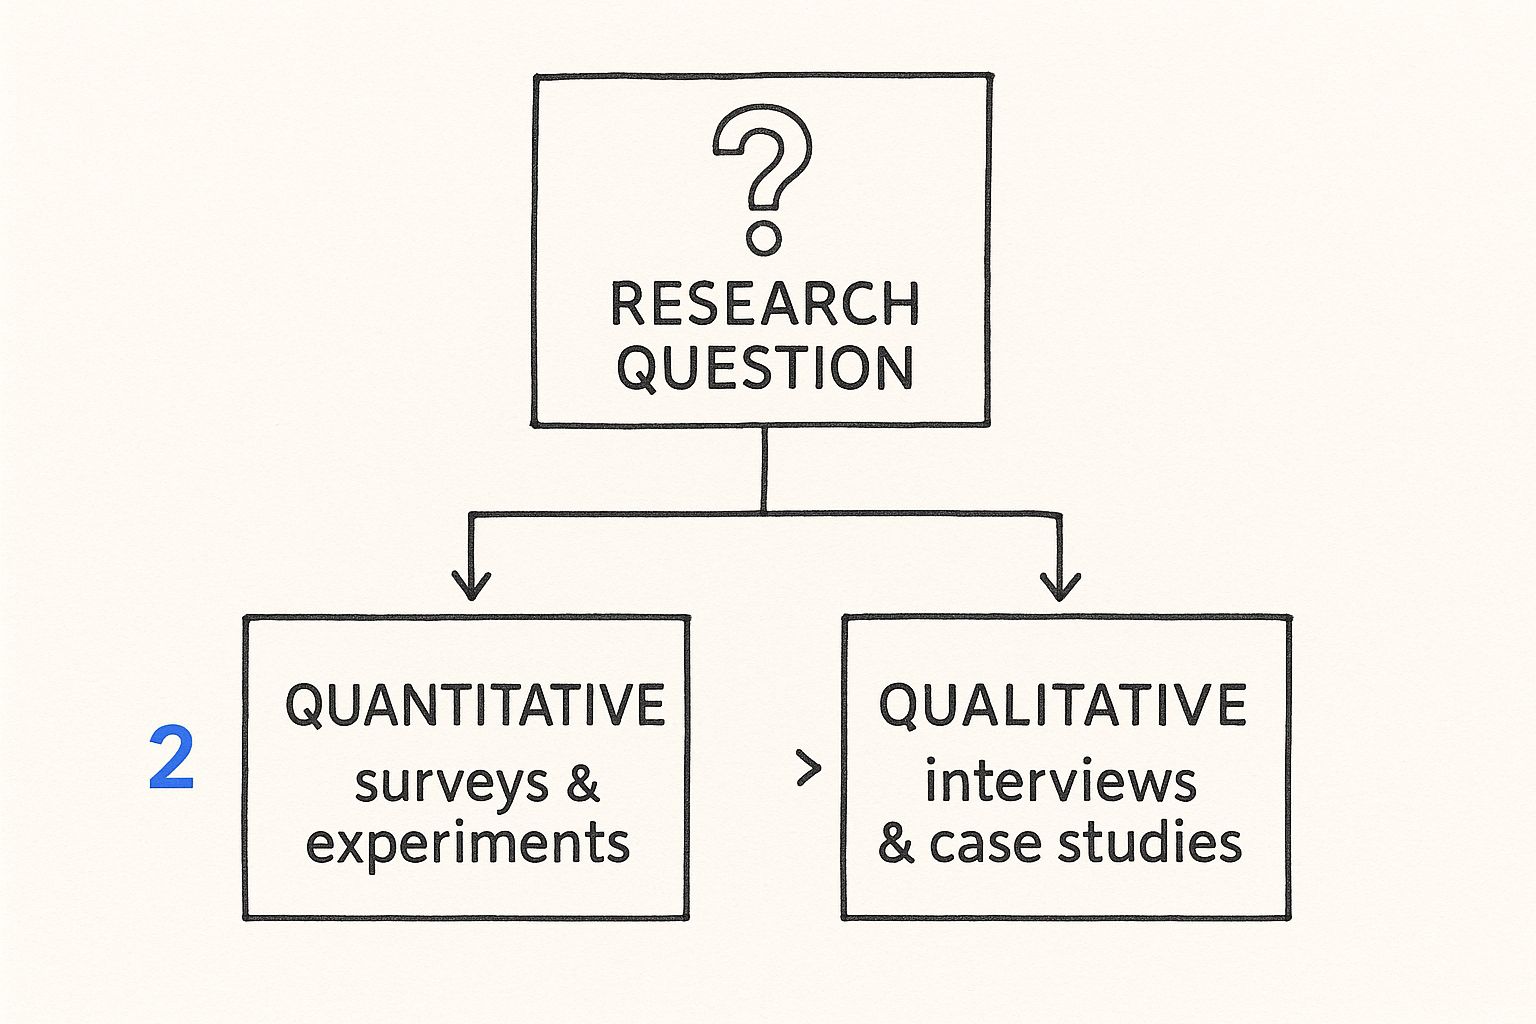
As you can see, the nature of your question is the main driver for your entire research strategy.
Next, you have to define your population—the specific group of people you want to study and draw conclusions about. Are you interested in university students in Canada, software developers at tech startups, or nurses in urban hospitals? The more specific, the better. From this larger group, you'll select a smaller, manageable sample to actually collect data from.
Creating Your Research Plan
With these big pieces decided, it’s time to formalize everything in a research plan or proposal. This isn't just bureaucratic busywork; it's an essential document that forces you to think through every detail of your project before you start. A solid plan keeps you from getting sidetracked and ensures you stay focused on your goal.
A research plan is your project's roadmap. It outlines not just what you'll do, but also why you're doing it, ensuring your methods logically connect back to your central research question.
Your plan should spell out the following:
- Your Research Question: Stated clearly and concisely.
- Literature Review Summary: A quick rundown of what's already known about your topic.
- Chosen Methodology: Justify your choice—quantitative, qualitative, or mixed-methods—and explain why it’s the best fit for your question.
- Data Collection Methods: Get specific about how you'll gather data (e.g., survey design, interview protocol, observation checklist).
- Population and Sampling Strategy: Define who you're studying and exactly how you'll select your participants.
- Data Analysis Plan: Outline how you’ll make sense of the data once you have it. What software will you use? What statistical tests or coding techniques?
- Ethical Considerations: Explain how you will protect your participants, ensure their confidentiality, and get their informed consent.
Thinking about ethics from day one isn't optional—it's non-negotiable. It's what ensures your research is conducted responsibly and with respect for the people who are giving you their time and insights. This design phase truly sets the foundation for everything that follows.
Selecting Your Data Collection Toolkit

Alright, you've got your research plan mapped out. Now for the fun part: getting your hands dirty and gathering the raw materials—your data.
Think of yourself as a chef picking the right knives for a specific dish. A delicate filleting knife is perfect for fish, but you wouldn't use it to chop root vegetables. In the same way, the data collection tools you choose have a specific purpose, and picking the right one will directly shape the quality and flavor of your findings.
This is where your research methodology stops being a theoretical exercise and becomes a practical, hands-on process. For quantitative research, this often means mastering the survey. For qualitative work, it's about learning the art of the interview or observation.
Quantitative Tools: Surveys and Questionnaires
When you need to collect numerical data from a large group of people efficiently, surveys are your go-to tool. They are fantastic for gathering standardized information that you can easily compare and analyze statistically. Think of a survey as a structured, written conversation you have with hundreds, or even thousands, of people at once.
But be careful—a poorly designed survey can poison your data before you even start. The absolute key is to create clear, unbiased questions that everyone will interpret in the same way. This means avoiding leading questions that subtly nudge respondents toward a particular answer.
For example, instead of asking, "Don't you agree that our new feature is amazing?" you should ask something neutral like, "How would you rate our new feature on a scale of 1 to 5?"
Here are a few hard-won tips for effective survey design:
- Keep it brief. Seriously. Long surveys kill motivation and lead to half-hearted or incomplete answers.
- Use simple language. Ditch the jargon. If your audience might not understand a term, don't use it.
- Offer clear choices. For multiple-choice questions, make sure the options are distinct and cover all the likely responses. An "Other" option is your friend.
- Pilot test your survey. Always, always have a small group take your survey first. They will catch confusing questions and awkward phrasing you missed.
Qualitative Tools: Interviews, Focus Groups, and Observation
When your research is less about "how many" and more about the "why," you’ll need to turn to qualitative tools. These methods are all about gathering rich, detailed, and contextual data that gets at the heart of people's motivations, feelings, and experiences.
Interviews are one-on-one conversations that let you dive deep into an individual's unique perspective. They can be highly structured, with a strict script of questions, or semi-structured, which allows for more flexibility to chase interesting ideas as they pop up. The real goal isn't just to get answers, but to understand the story behind them. Focus groups bring a small crew of people together (usually 6-10) to discuss a specific topic. The magic here is in the group dynamic. Participants often build on each other's comments, creating a much richer and more nuanced discussion than you might get from individual interviews. In fact, a recent study found that 85% of researchers use focus groups to gauge initial consumer reactions before a product launch.Finally, there’s observation, which involves systematically watching and recording behavior in its natural setting. This tool is incredibly powerful because it shows you what people do, not just what they say they do. A researcher might observe how shoppers navigate a grocery store to truly understand their decision-making process, rather than just asking them about it later.
Each data collection method offers a different lens through which to view your research problem. The best approach often depends on whether you need breadth (from many people) or depth (from a few).
Choosing the Right Data Collection Method
Deciding which tool to pull out of the toolkit can feel a little daunting at first. Your choice should always be driven by your core research question. But let's be realistic—practical things like your timeline, budget, and access to participants also play a huge role.
To help you sort through the options, I’ve put together a quick comparison of the most common methods.
Choosing the Right Data Collection Method
A comparative look at common data collection methods to help beginners select the most appropriate technique for their research question.
| Method | Best For | Key Advantage | Potential Challenge |
|---|---|---|---|
| Surveys | Gathering data from a large sample to identify trends and patterns. | Scalable, cost-effective, and provides quantitative data that's easy to analyze. | Lacks the depth to understand the "why" and can suffer from low response rates. |
| Interviews | Gaining in-depth understanding of individual experiences and perspectives. | Provides rich, detailed qualitative data and allows for follow-up questions. | Time-consuming to conduct and analyze; findings are not easily generalizable. |
| Focus Groups | Exploring group dynamics, shared opinions, and generating new ideas. | Reveals a range of opinions quickly and allows participants to build on ideas. | A dominant personality can skew the conversation; can be difficult to schedule. |
| Observation | Understanding behavior in a natural context without direct interference. | Captures what people actually do, rather than what they report doing. | Can be subjective and time-intensive; the observer's presence might influence behavior. |
By weighing these factors, you can make a smart, informed decision that truly aligns with your project's goals. Picking the right tool is a critical step in building a successful research project from the ground up.
Making Sense of Your Research Data
You did it. You’ve collected all your data—the surveys are complete, the interviews are transcribed. Now you're staring at this mountain of raw information and probably thinking, "Okay, now what?"
This is the analysis stage. It’s where you roll up your sleeves and transform that raw material into actual insights that answer your big research question. Forget about being a data scientist for a moment; your real job here is to be a detective, looking for clues and connecting the dots.
Think of it like this: your raw data is a jumbled box of puzzle pieces. Right now, it’s just a chaotic mess. Data analysis is the process of patiently flipping those pieces over, finding the straight edges, grouping them by color, and slowly piecing together the picture you set out to find.
Getting a Handle on Your Quantitative Data
If your research involved numbers—survey ratings, experiment results, poll answers—your first step is to just get a feel for what you’re looking at. This isn't about advanced calculus; it’s about starting with what’s called descriptive statistics. It’s just a fancy term for summarizing your data to spot the most obvious patterns.
You already know the basics, even if you don't realize it:
- Mean (Average): The classic. Add everything up and divide by how many you have. It gives you a quick snapshot of the "typical" response.
- Median: The true middle value when you line up all your numbers in order. This is super useful if you have a few really high or low scores throwing off your average.
- Mode: The number that shows up most often. This tells you what the most popular or common answer was.
These simple calculations give you an immediate sense of your data's landscape. For example, learning that the average customer satisfaction score is 4.2 out of 5 is a fantastic starting point. Once your numbers are in, making sense of them is the next critical step. For a complete walkthrough, it’s worth checking out a beginner's guide to analyzing survey data.
Finding the Story in Your Qualitative Data
But what if your data is made of words? Think interview transcripts, open-ended survey answers, or observational notes. You can't find an "average" of a story, but you can find themes and patterns. The best way to start is with thematic analysis.
This method is all about combing through your text and identifying recurring ideas or topics—these are your "themes." It’s a lot like highlighting a textbook, but instead of just marking important lines, you're actively grouping similar ideas together to build a bigger concept.
Here’s a quick and dirty way to get started:
- Just Read It: First, read through all your transcripts or notes. Don't try to analyze yet, just get a feel for what people are saying.
- Start Coding: Go back through, line by line, and attach short labels (codes) to interesting phrases. A comment like, "I felt so disconnected working from home," could be coded as "loneliness" or "remote work challenges."
- Hunt for Themes: Now, look at your codes. Do you see patterns? For instance, codes like "loneliness," "communication gaps," and "no team spirit" might all point to a bigger theme you could call "Barriers to Remote Collaboration."
- Review and Refine: Take a step back. Do your themes really tell the story in the data? You might need to merge a few or split one into two to make sure everything is clear and accurate.
This process is how you turn hundreds of individual comments into just a handful of powerful, evidence-backed insights.
Tools That Make Life Easier
The good news is you don't have to do all this with a pen and paper. In 2005, fewer than 30% of beginner research projects used digital survey tools, but that figure is expected to jump past 85% by 2025. Likewise, the use of basic statistical software has shot up from under 40% to over 75% among new researchers in the last ten years alone.
The point of analysis isn't just to summarize what you found. It's to interpret it. You have to constantly ask: What does this mean? Why is this happening? And does it actually answer my original question?
You don’t need anything complicated to get started. Here are a few user-friendly options:
- Spreadsheets (Google Sheets, Microsoft Excel): Don't underestimate them! They're perfect for basic quantitative analysis. You can calculate means, make charts, and sort data to spot trends in minutes.
- NVivo or ATLAS.ti: These are the go-to tools for qualitative analysis. They help you organize, code, and see the connections in your text-based data. Many universities even offer free licenses for students.
At the end of the day, data analysis is the bridge that connects your raw findings to your final conclusion. By taking it one step at a time, you can confidently turn a pile of numbers and narratives into a compelling and credible answer.
Common Questions About Research Methodology
Diving into research can feel like learning a new language. You're suddenly surrounded by unfamiliar terms and unwritten rules, and it's easy to feel a little lost. If you've got a lot of questions, you're not alone—that's a normal part of the process.
Let's clear the air and tackle some of the most common questions that trip up new researchers. Our goal here is to sort out any confusion so you can get back to what's important: your research.
What Is the Difference Between Research Methodology and Research Methods?
This is, without a doubt, the number one point of confusion for beginners. The terms sound almost interchangeable, but they represent two very different levels of thinking about your research.
The easiest way to get it straight is to think of the "why" versus the "how."
Your research methodology is your big-picture strategy. It’s the overarching logic that justifies your entire approach. It explains why you chose a certain path—for instance, deciding that a quantitative study is necessary because you need to statistically test a hypothesis. It’s your game plan.
Research methods, on the other hand, are the specific tools and procedures you use to carry out that plan. They are the "how"—the hands-on steps you take to collect and analyze your data. This includes things like designing a survey, conducting a focus group, running a lab experiment, or performing a statistical analysis.Think of it this way: Your methodology is the architect's blueprint for a house. Your methods are the specific hammers, saws, and bricks you use to actually build it.
One provides the strategic vision, while the others are the practical tools needed to bring that vision to life.
How Do I Choose the Right Research Methodology for My Project?
Your choice of methodology should never be random. It all boils down to one thing: your research question. This is your North Star. Everything you do should be in service of answering that question.
To figure out which path to take, ask yourself one of two simple questions:
- Am I trying to measure, test, or find a cause-and-effect relationship? If your goal is to work with numbers to quantify a problem or test a theory, then a quantitative methodology is your best bet.
- Am I trying to explore, understand, or uncover in-depth motivations? If you’re looking to understand personal experiences, explore a complex topic without a set hypothesis, or get to the "why" behind a behavior, a qualitative methodology will get you where you need to go.
Of course, sometimes one approach just isn't enough to capture the full picture. In that case, you might consider a mixed-methods approach, which combines the strengths of both.
Finally, you have to be pragmatic. Think about your available time, your budget, and whether you can realistically access the people or data you need. The most elegant methodology in the world is useless if you don't have the resources to execute it.
What Are Common Mistakes to Avoid in Research Methodology?
Every researcher, no matter how experienced, makes mistakes. But knowing the common pitfalls from the start can save you a world of headaches later on.
Here are a few classic blunders to keep on your radar:
- A Mismatch Between Question and Method: This is the big one. It’s like using a hammer to turn a screw. You wouldn't use a survey to understand deep, personal trauma, or conduct two interviews and then try to generalize the findings to an entire population. Always make sure your tools fit the job.
- Poor Sampling: Your findings are only as reliable as the group you study. If you only poll your friends or people who already agree with you, your results will be heavily biased. A flawed sample can completely undermine your study's credibility.
- Unclear Research Scope: So many beginners try to solve the world's problems in a single study. They start with a research question so broad it’s impossible to answer properly. The result is usually a shallow, unfocused project. Get specific and narrow your focus. It's better to answer one small question well than five big questions poorly.
- Overlooking Ethical Considerations: This isn't just a mistake; it's a critical failure. Forgetting to get informed consent, failing to protect your participants' privacy, or being dishonest about your research goals can have serious consequences. Ethics must be a top priority from day one.
Juggling all the different parts of a research project—from finding papers to managing citations—can be a real grind. Eagle Cite was built to streamline that whole process. It’s an AI-powered citation manager that helps you organize sources, highlight key insights, and find what you need with a simple, natural-language search. You get to spend less time on tedious admin work and more time on the thinking and writing that actually moves your project forward. Give the 14-day free trial of Eagle Cite a try and feel the difference in your workflow.